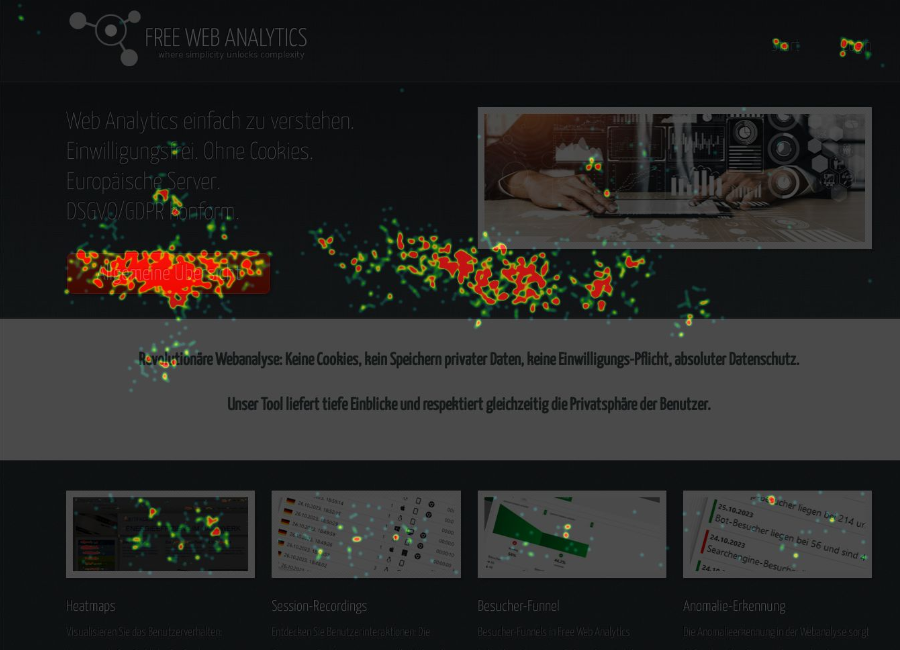
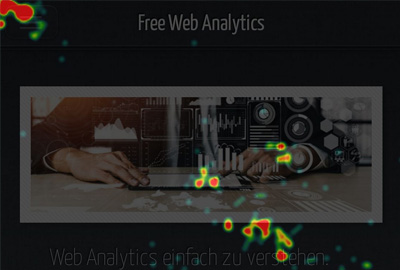
Heatmaps are an indispensable tool in the field of web analytics, offering comprehensive insights into user behavior on a webpage. The online analytics tool "Free-Web-Analytics" provides heatmaps for both desktop and smartphone visitors
Visual Insight into User Interactions
Heatmaps offer an immediately understandable visual representation of data by using color-coded "heat zones" to indicate areas of high interaction density. This makes it easy to see at a glance which parts of a webpage are attracting the most attention.
Identification of Engagement Hotspots
A key advantage of heatmaps is the ability to identify areas on a webpage that experience the most interaction. This can provide important insights into which contents or calls-to-action are most effective.
Improving User Experience
By understanding which areas of a webpage are most engaging to users, web designers and developers can make targeted adjustments to improve the user experience. This could include redesigning or highlighting less noticed areas.
Optimization for Mobile Users
Since "Free-Web-Analytics" offers heatmaps for smartphone visitors, users can gain valuable insights into how engagement on mobile devices differs from that on desktop computers. This information is crucial for optimizing the mobile user experience.
Understanding Click Behavior
Click heatmaps show where users click on a webpage. This can reveal whether users are trying to click on non-interactive elements, which might indicate design issues, or whether certain buttons or links are particularly effective.
Detection of Navigation Issues
Heatmaps can uncover areas where users may have difficulty navigating. If users spend a lot of time hovering over certain areas of a webpage without interacting, this could indicate a navigation problem.
Supporting Content Strategies
Heatmaps can help inform content strategy. By understanding which contents attract the most attention, future content can be better aligned with the interests and preferences of the target audience.
Reducing Bounce Rate
By improving the user experience and navigation based on heatmap data, the bounce rate can potentially be reduced, as users are more likely to stay on the site and interact with the content.
Insights into User Preferences
Heatmaps can also provide indirect insights into user preferences. For example, recurring patterns in interaction can indicate which types of content or design elements are preferred.
Conclusion
The "Free-Web-Analytics" heatmap features represent a powerful tool for website optimization. They provide comprehensive insights into user behavior and enable targeted improvements to enhance user experience, increase interaction, and ultimately achieve the goals of the website more effectively.